TLDR: Demonstrated thermal flow from a hot plate across 3 metal cubes using a thermal camera with a Raspberry Pi
This project was developed for my freshman design class. For our project, my team had to make a demonstration of thermal flow for a high level mechanical engineering class at Rice. This freshman design class walked us through a full engineering design process, where we researched our problem, selected design criteria, brainstormed ideas, prototyped, and tested our design. We wrote extensive documentation through this process, but written below is a very condensed story of our work.
Design Process:
Starting off, we researched a bunch of different existing models and demonstrations of energy flow. For example, we investigated a pendulum swing and Joule’s experiment. This research informed our selection of design criteria, which we chose as follows:

Following this, we did a big brainstorm to try and identify every idea we could have and then we used our design criteria to weed them down to a single design idea.

Brainstorming ideas

Drawing of our chosen design
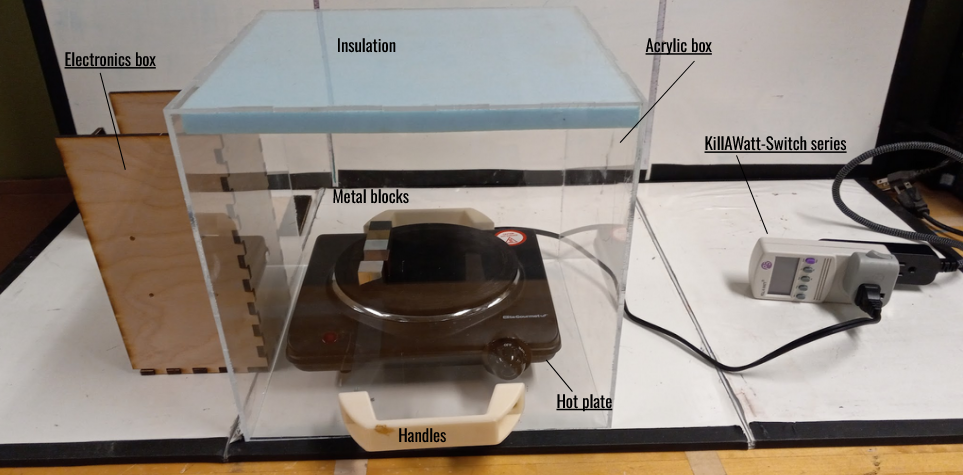
Our final prototype. The hot plate heats the metal blocks, and a thermal camera records the blocks heating up. The acrylic box keeps the system insulated and the KillAWatt measures the energy inputted into the system.
We decided on a design that included a hot plate that would heat up metal cubes. A thermal camera would video the heat traveling up the cubes for a visual demonstration. A multimeter would be used to record the power (and thus, the energy inputted in the system) that the hot plate uses, and the whole system would be insulated with a transparent acrylic box.
Then we began to prototype our design. We began with a low-fidelity prototype made out of arts-and-crafts materials to get a feel for our design, then we moved on to developing a higher-fidelity prototype.
I took the task of getting the thermal camera to work, due to my previous experience working with cameras and embedded systems. Using a Raspberry Pi, I wrote a program that shows the live video from the thermal camera and uses color to show the temperatures.
Testing:
Due to time constraints, we had to begin testing our second prototype while we were still developing it. Our tests included a drop test for the components and a fluid containment test for the acrylic box. I personally performed tests on the thermal insulation of the model and on the accuracy of the thermal camera.
Our measurement accuracy test involved comparing the thermal camera’s measurements with that of an IR thermometer gun. We found the accuracy to differ with different materials, where the measurements of the hot plate temperature being about equal to the measurements of the copper block having a 24% difference between each other.
The thermal insulation test compared the energy stored in the model with the energy that was inputted into the system. The demonstration was ran until the hot plate reached 200 degrees Celsius, then the energy within the system was calculated using the temperatures and specific heats of each material. This was then compared to the total amount of electrical energy that was fed into the hot plate. I found a 46% difference between these two totals, meaning our model was not sufficiently thermally insulated. Looking back, I think failing to consider the energy within the electrical components of the hot plate possibly influenced this result.
Reflection:
Unfortunately, nearing the end of the class, we had two complete disasters for our project. First, while my teammate was soldering electronics together, they ended up accidentally breaking our thermal camera, rendering it unusable. Secondly, right before our final presentation, I accidentally corrupted our Raspberry Pi’s SD card, leaving us with no live demonstration like we had planned. Looking back, I think that some precautions, such as backing up of code and more careful electronics design would have helped us immensely.
I also am not satisfied with our design. To be frank, I think that for a team of freshmen with not much knowledge of thermal flow, we did pretty well. However the design left a lot to be desired. It wasn’t well insulated, there were too many parts for a professor to be able to figure out how to use it, and our instrumentation wasn’t accurate enough.
This class was my first introduction to a specific engineering design process, and it very much influenced the engineer that I am today. Although our project was a failure and I don’t think our design was that good, this was a very positive experience for my development. Through us consistently underestimating the time it would take to complete tasks, I learned about project management. From going through the design process, I learned about what was important when designing an engineering solution. From developing our bad design, I learned more about what makes a design good (or, at least not bad)
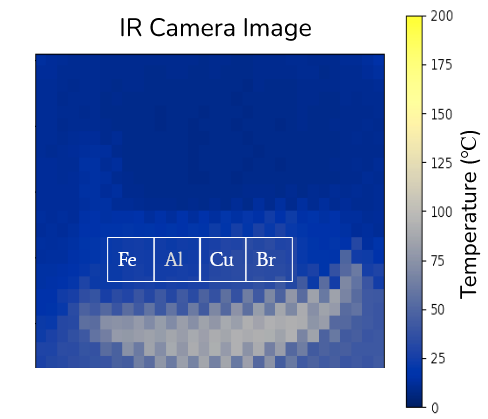
Image taken with the thermal camera. Location of the metal blocks is drawn. The hot region below them is the hot plate.

Results of thermal insulation testing
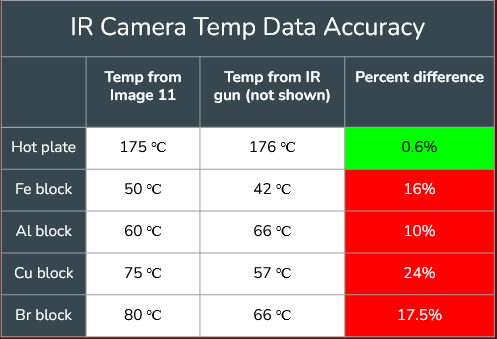
Results of measurement accuracy testing

Graphic view of the demonstration, including live video, an updating graph of different temperatures, and a calculation of energy added to the system and energy within the system. After the thermal camera broke, we replaced the live video with a random matrix of temperatures.
Thermal Flow Demonstration
August 2021 - December 2021